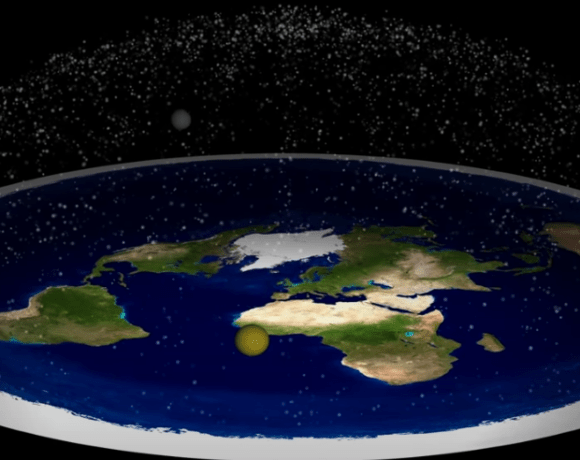
A small spirit level seems an appealing companion for a big question. Place it inside an aircraft, watch the bubble during a long flight, and ask whether the journey reveals anything about Earth’s shape. D. Marble’s Flat Earth PROOF: Spirit Level Flight Experiment builds its argument around that simple setup. The experiment invites a closer look at a word we use every day: level.
The useful question is whether the instrument could distinguish the competing explanations. To answer that, we need to follow the bubble, the aircraft and the reference line used in the curvature calculation separately.
The claim in its original form
In the description of his original flight experiment video, published in May 2017, D. Marble reports recording a time-lapse covering 23 minutes and 45 seconds. He assumes a speed of 515 miles per hour, cites an announced altitude of 34,000 feet and estimates a distance of approximately 203 miles. He compares that journey with roughly five miles of curvature and interprets the absence of a measured level change as evidence for a flat Earth.
Those flight figures are the creator’s account, rather than independently verified flight logs. Multiplying the stated speed by the stated duration gives about 204 miles, reasonably close to the description’s rounded distance. Whether that speed represents ground speed also matters when calculating distance over Earth’s surface.
The main difficulty arises after the distance calculation: what change should this particular instrument register?
What a spirit level actually measures
A spirit level contains liquid and a bubble inside a slightly curved vial. When the instrument is stationary, the bubble settles at the highest available point. Its position indicates the instrument’s orientation relative to the local direction of gravity.
That word local matters. The bubble carries no memory of the direction called horizontal at the departure airport. Move the instrument, let it settle, and it responds to conditions where it now sits.
NOAA’s Geodetic Bench Marks manual explains that a surveying level indicates a direction perpendicular to local gravity. It also describes the geoid, a reference surface associated with mean sea level, as an equipotential surface. In plain language, gravitational potential is the same along that surface, while the direction of down changes from place to place.
A level can therefore give the same reading at two locations whose local horizontal directions differ.
Where the five-mile figure belongs
Imagine drawing a straight line that just touches a circle. That line is a tangent. As you follow the circle away from the touching point, the circle falls increasingly below the original line.
Using a spherical Earth with a radius of about 3,959 miles, a 203-mile journey corresponds to approximately 5.2 miles below the starting tangent. This is a simplified geometric calculation, not a measurement extracted from the video. It also corresponds to a change of roughly 2.9 degrees in the direction of the local horizontal.
The five-mile figure compares positions with one fixed starting line. It does not describe a five-mile loss of altitude, or require the cabin to tilt progressively downward relative to the local horizon.
In the simplified spherical model, an aircraft maintaining constant geometric altitude follows a curved equipotential surface. The local direction of gravity changes along the route, and the aircraft’s orientation can change with it. A bubble level travels through those changing local directions too. Its reading does not accumulate the angle between the current horizontal and the departure horizontal.
Altitude, pitch and a moving cabin
Aircraft altitude, the direction of the flight path and the angle of the fuselage are related but distinct quantities. An aircraft can maintain altitude with its nose slightly above the local horizon because the wings need an appropriate angle to the airflow.
The FAA’s flight-instruments handbook chapter distinguishes instruments that report attitude from those that report altitude and vertical speed. A passenger’s bubble level does not replace those measurements. Real cruising flight commonly follows pressure altitude, which is not precisely the same as maintaining a fixed geometric height under all atmospheric conditions.
Movement adds another complication. Inside an accelerating aircraft, liquid responds to apparent gravity: the combined effect of gravity and the aircraft’s acceleration. Speed changes, turns and turbulence can affect the reading. A cabin surface also has its own angle relative to the aircraft.
A curved flight path involves acceleration even at constant speed, because the direction of motion changes. In a simplified constant-altitude flight around a spherical Earth, that inward acceleration can coexist with a steady bubble reading. There is no requirement for the bubble to creep toward one end throughout the journey.
What would make the experiment stronger?
A useful next step would begin with written predictions from each proposed model. Both must describe the expected bubble position, including the instrument’s response to motion. Predicting a drop below a tangent is insufficient unless that prediction is translated into something the instrument measures.
A more complete record would include:
- The level’s sensitivity, calibration and orientation within the cabin.
- A secure, documented mounting arrangement and an uninterrupted recording.
- Time-aligned position, ground speed, altitude, attitude and acceleration data.
- An estimate of measurement uncertainty and the size of the difference expected between models.
An independent orientation reference would also need careful definition. Simply adding another bubble level would repeat the same kind of measurement. Any comparison with a fixed direction would need to account for the motion of the aircraft and Earth, as well as the behavior and accuracy of the reference instrument.
These details would help separate actual instrument behavior from assumptions about the flight. Any passenger observation should remain unobtrusive, comply with crew instructions and avoid altering aircraft equipment.
Even excellent footage cannot turn a measurement into a decisive test when both explanations permit that measurement. The instrument and the predicted difference have to match.
Where density and buoyancy fit
The video description also disputes gravity and proposes density and buoyancy as explanations. Density describes how much mass occupies a given volume. By itself, it supplies neither a direction nor a force that makes an object accelerate.
Buoyancy explains why a bubble rises through liquid. As OpenStax’s treatment of Archimedes’ principle shows, the upward force comes from pressure differences through the fluid. In ordinary stationary conditions, those differences depend on gravity. Invoking buoyancy therefore leaves the origin of that pressure pattern to be explained.
Gravity also has laboratory evidence beyond objects falling through air. NIST describes torsion-balance experiments that measure attraction between masses, including an instrument operating in a vacuum. Scientists continue to investigate discrepancies in precise measurements of gravity’s strength. Those uncertainties concern the measured value, rather than an absence of observed attraction.
Let the measurement set the conclusion
D. Marble’s setup makes a worthwhile question tangible. Taking it seriously means asking exactly what the bubble can tell us. A stable reading can be consistent with flight around a curved Earth because the instrument responds locally, without retaining a fixed departure reference.
The experiment, as described, does not establish a flat Earth. Its most useful lesson is practical: before interpreting a quiet instrument as a surprising discovery, check whether the expected signal should have appeared on that instrument at all.